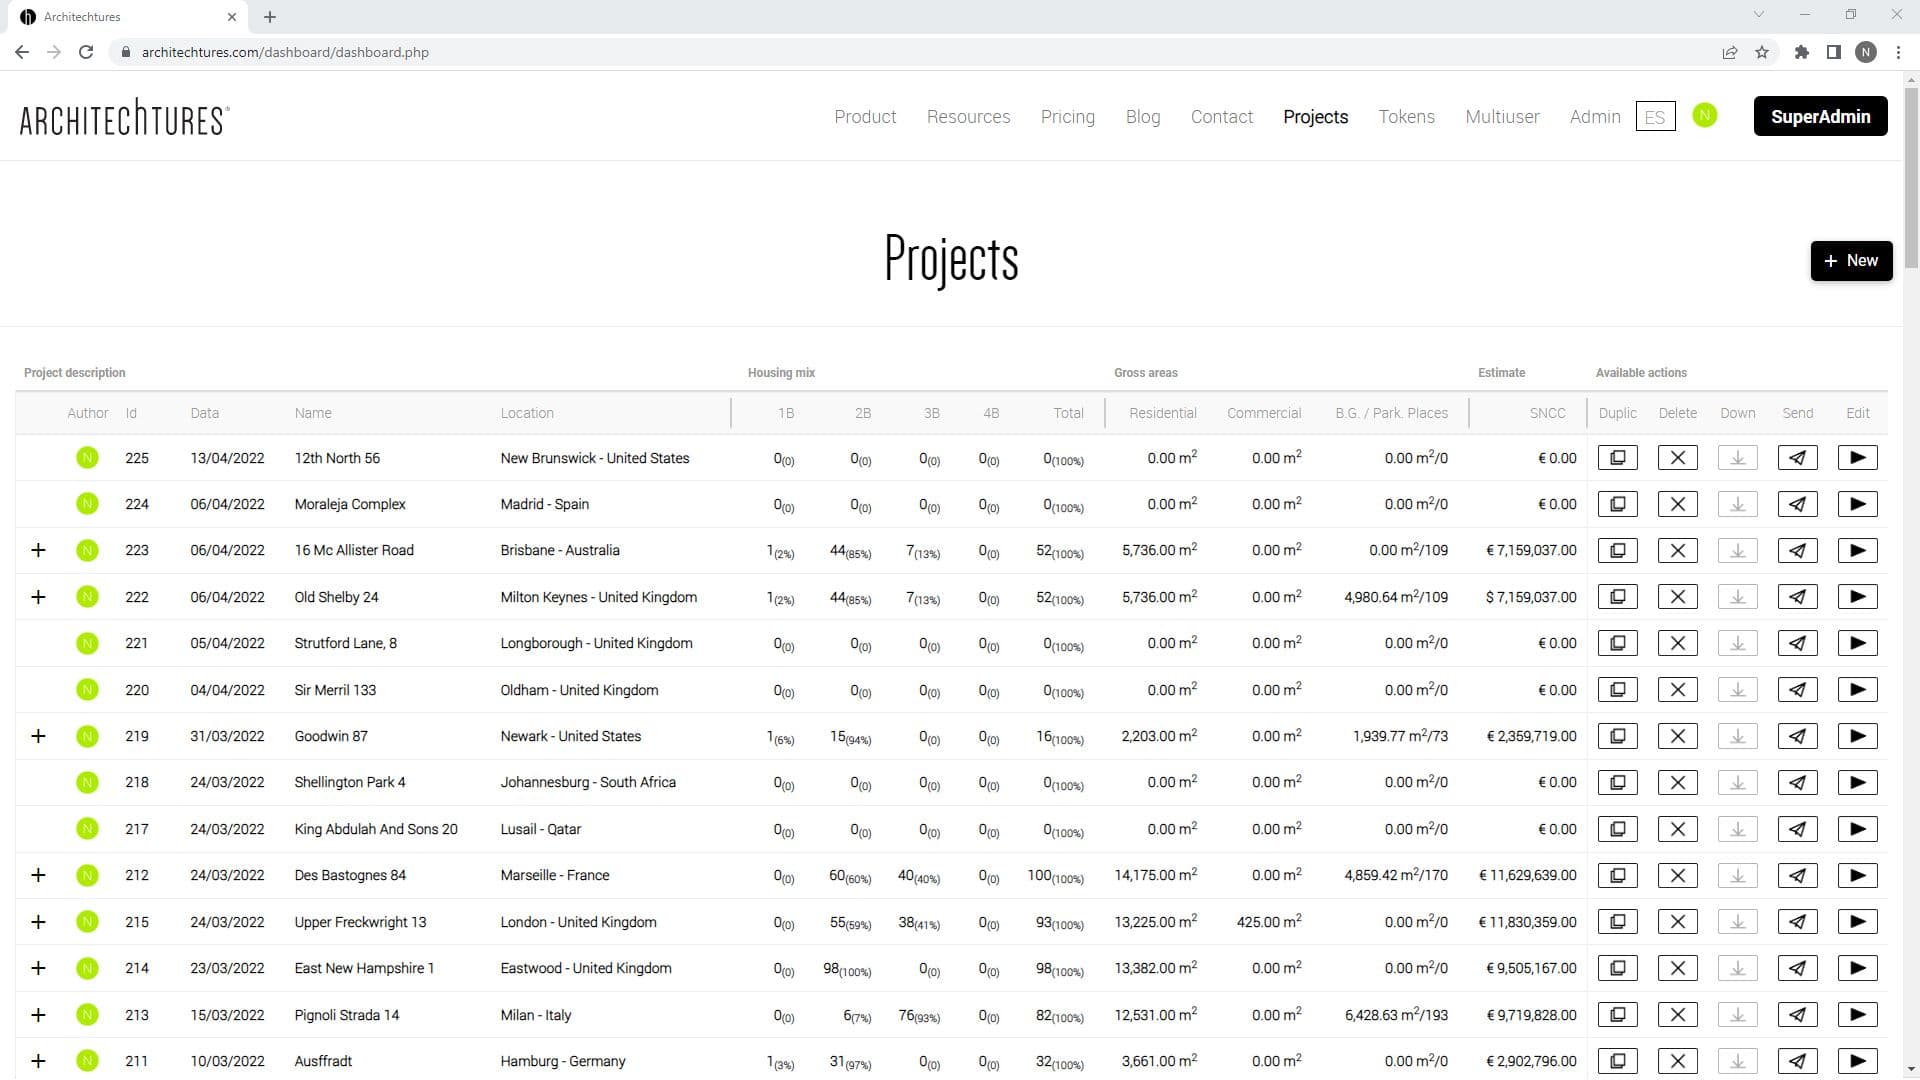
Residential Development Design – AI Powered Site Planner
Posted 9/19/2023 in Education
Residential Development Design can be a hassle, usually involving a lot of back and forth. That is why it it is of paramount importance to streamline this process to speed it up. With Architechtures AI Powered Site Planner, creating buildings, fiting them into the plot and nailing the housing mix has never been easier. Read on to step up your game.
At the Site Planner level we explore the Residential Development Design working with all the buildings on the plot. In architectural terms the natural scale is usually in the order of 1:500 upwards.
Views at the Site Level – Site Planner:
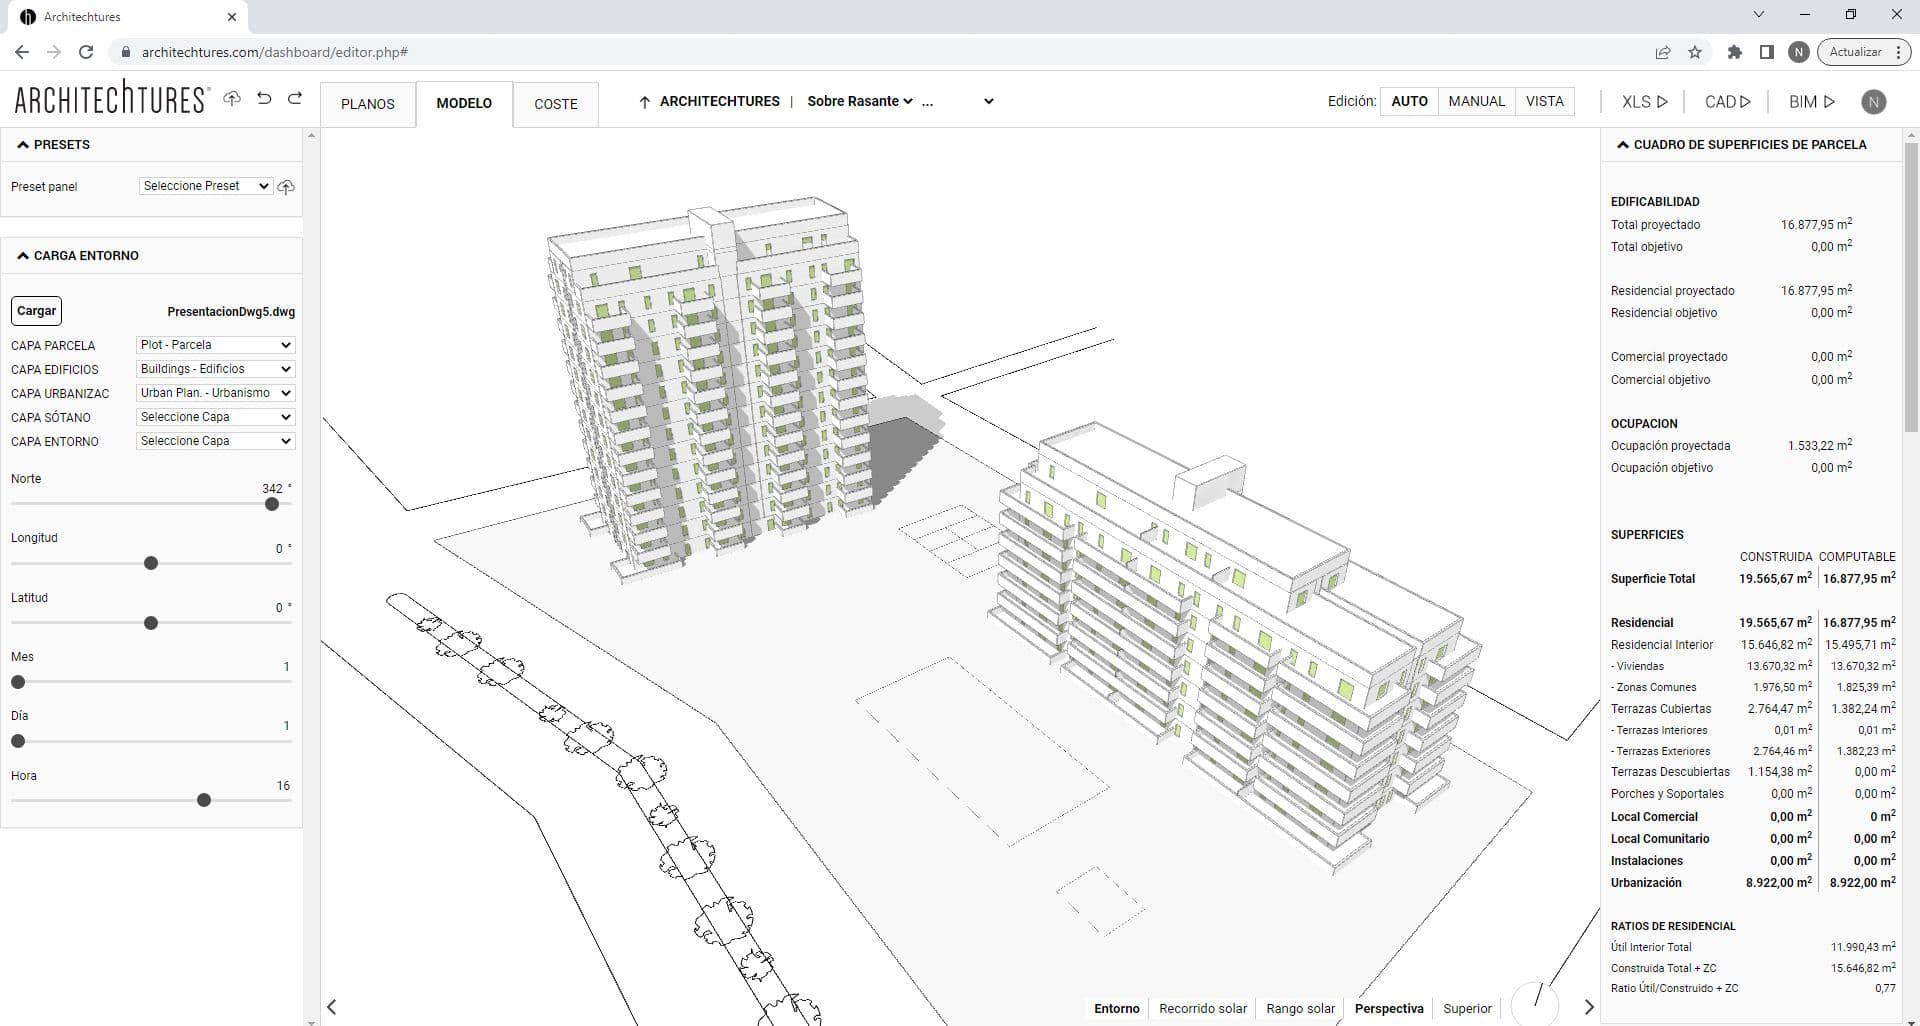
Above Grade – Residential Development Design
Also more commonly known as the site view. At this level we can create and move buildings around to explore how they fit on the plot. Although we may only edit the buildings general width and length. To edit them in more detail we must progress to the Building-Floor level. The Building-Floor Section explains this in more detail.
Below Grade Level – Parking Garage Design
Also known as basement floors or parking floors. Here we create and edit the basement and its circulation, optimizing its efficiency.
This section explains how the above-ground view works. Section 7- Basements – Parkings explains The Below Grade view.
Workflow and The Creative Process In Development Design
Two different zones controll all interactions with the project:
Input Panel
Located on the left side of the screen, this is where we enter data in an analytical way. That is to say, we give information in the form of data such as numbers or texts. This panel updates its content, offering different options depending on the level we are at.
Central window
Located in the centre of the screen, here we interact directly with the geometry, creating or selecting elements and customising them.
Site Planner- Central Window
The central window is where the project is displayed in its current state and where we interact with specific elements of the geometry.
The navigation tools are:
In Plan view mode:
The left mouse button to drag the view (pan) and the wheel to control the zoom level.
In Model view mode:
The left mouse button controls the camera orientation (orbit), the right mouse button drags the view (pan) and the mouse wheel controls the zoom level.
Manual editing tools – Development Design Basics
In the central viewing window we can find in the upper right corner the manual editing menu.
To facilitate the use of the tool we have tried to make the manual editing similar to programs such as Revit or AutoCAD.
Plot
With it we can draw polylines as we would do in a CAD program. We can enter length values numerically and we also have available snaps and alignments. We can customize these in the menu at the bottom of the central window, as we will see later.
When we close the polyline, the tool will recognise it as a plot.
Building
With this we building axes. Once created the AI will automatically create a layout according to the default design criteria. We can later modify the criteria within the building, and its dimension by selecting it to access its attributes in the upper right corner.
When the button is pressed, the input panel will update to allow specification of the building's characteristics. As soon as we have buildings the data panel on the right pops up.
Urban
With it we can draw whatever we want or use it as an auxiliary reference to help us to better place the buildings.
Split
With it we can split drawing lines or plot lines.
Trim
With it we can create a clipping mask of the building from a closed polyline.
Environment
With it we can create the buildings of the environment, first we will draw a polyline and once we close it we can select the area and give it a height.
Other general tools
We can drag the existing lines or their nodes, as we would in other CAD programs. In this way we can move or rotate a building by manipulating its axis.
If we click on a building instead of dragging it, we will select the building. Once selected, its attributes will appear in the upper right corner of the central window where we can modify them.
You will also find there the “Distance” option, which allows you to move the building parallel to its axis by a given distance. (Offset)
If we have the cursor over a building, it will appear shaded in green to indicate that if we click on it, we pass from the site view to the building view.
Visualization tools
At the bottom of the central window we can find the visualization tools.
In the Plan view mode

Reference to object allows us to activate or deactivate snaps and alignments.
Reference floor allows us to overlay the view of another floor on the current view.
Measure allows us to measure the distance between two points.
Dimensions enables or disables the relevant dimensions depending on the view level.
Mix turn the color shading on or off depending on the housing program on the building floor plans.
Environment enables or disables the display of the environment elements we have created or imported.
Minimum dimensions shows graphically the diameter inscribed in each space of the dwelling, applying a color criterion according to the difference with the minimum dimension required for that type of room.
Area calculates the area of the surface we define with a series of points.
Zoom + and Zoom – control the zoom level of the view.
The last elements are the graphic scale and the North symbol.
In the Model view mode
Again, Environment activates or deactivates the display of the environment elements you have created or imported.
Cameras Enables or disables existing cameras in the project.
Buildings activate or deactivate the display of existing buildings.
Solar Pathand Solar Range activate or deactivate the display of these solar position displays.
Perspective is the default view in the model view and is a conical view that the user can control with the mouse.
Top is a zenith view of the model that the user can also control with the mouse as they would in Plan view mode.
Site Planner – Data Panel – Development Design Metrics
The Data Panel on the right shows real-time information about the current status of the project. All of its metrics are updated in real time for each iteration of the design.
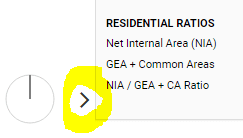
Both the Data Panel and the Input Panel can be collapsed to give more space to the central window. This can be done using these arrows located at the bottom of the screen on either side of the respective panel:
Likewise, each section in the panels can be collapsed by clicking on the section title. The arrow to the left of the section title will change to represent its current state.
In the site view the data panel contains the following sections:
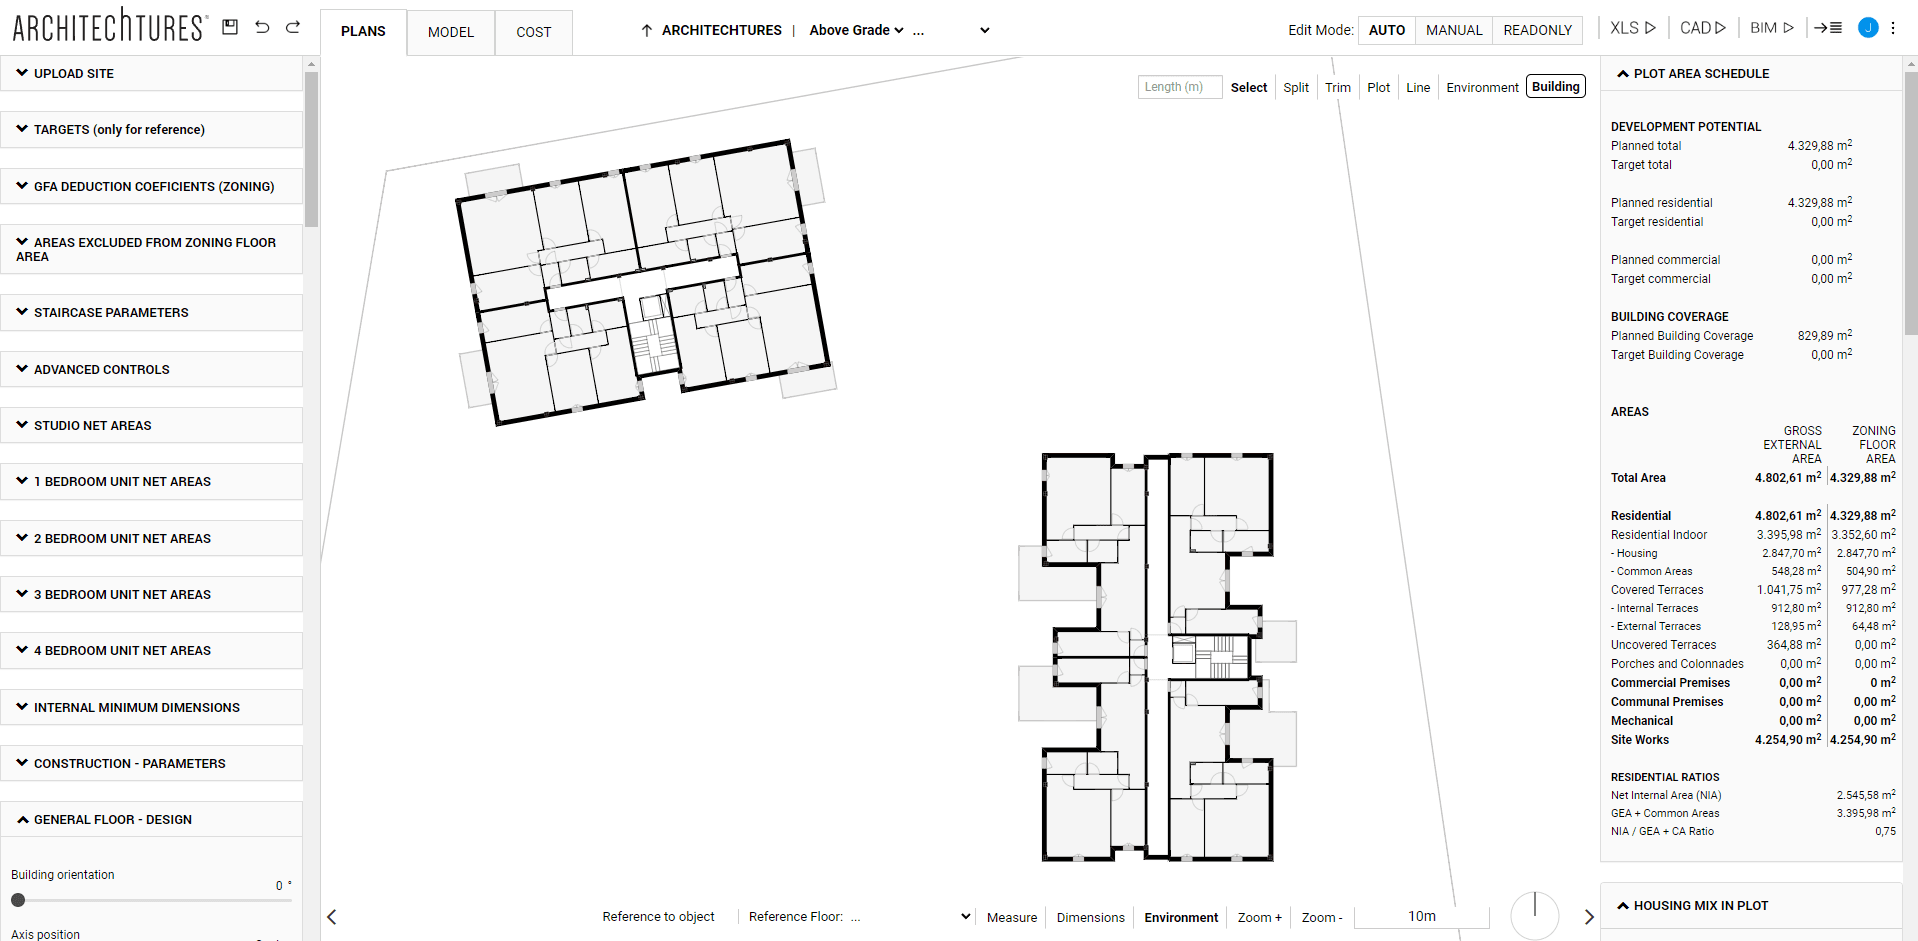
Plot Area Schedule
This shows our targets for the project, a breakdown of the main areas and the efficiency ratio (Net Internal Area / Gross External Area + Common areas).
Housing Mix in Plot
It shows the housing mix for the whole project and for every building in it.
Below Grade Areas and Ratios
Shows an area schedule summary for the basements, a parking space and storage room count and their ratios per dwelling unit.
Estimate Summary
Displays the estimate breakdown with the most relevant items and ratios.
If we have entered target goals for the project in the Reference data section in the input panel, in the section corresponding to that type of metric in the data panel we will find the target goal we have set, the current status for that metric, and the difference between the two highlighted in a color according to the relationship between them.
Green to indicate that the current state of the metric is exactly as desired or relatively close. Yellow and red to represent that the current state is a little or quite far from the desired state respectively.
Site Planner – Input Panel – Development Design Tools
The first section is the Presets section. It is used to save and load data and we will explain how it works a little later. Once we have a better understanding of the platform and the user interface, it will be easier to understand then.
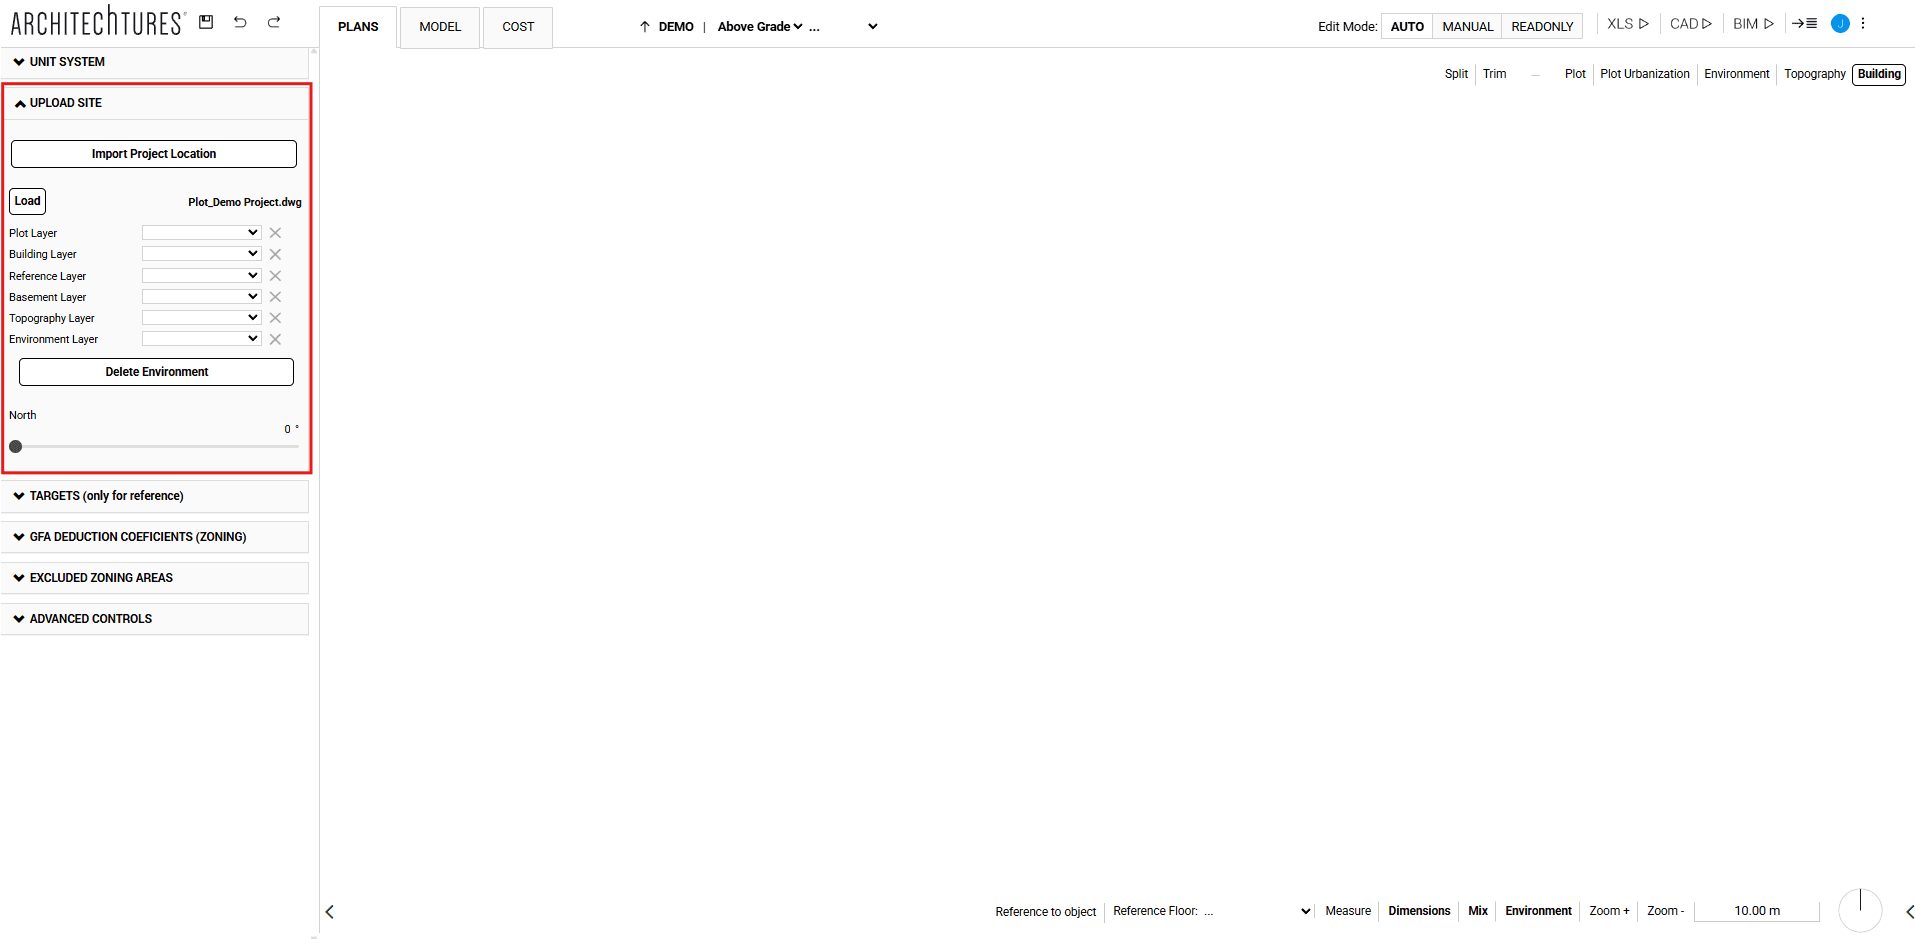
Upload Site
Currently, there are two ways to add an environment to your project: by importing a location from OpenStreetMap or by uploading a CAD file. In either case, keep in mind that importing a new environment will replace any previously loaded one.
Targets
In the Targets section, we can define reference data for our project through a number of metrics.
As explained above, these will appear in the Targets Panel (only for reference). They will also indicate how far or close our current project is to the targets we have set by means of a color code.
Zoning coefficients
Here are the coefficients used to calculate the zoning floor area from the gross external area according to the use of the area. This affects the zoning floor areas we see in the Area Schedules of the data panel.
These coefficients can change according to the zoning code of our plot and local regulations, their impact is very important to the profitability of a development. It is recommended to check that these coefficients are set up correctly before starting to create buildings.
Areas excluded from the calculation
The options in this section allow us to subtract a certain area per dwelling unit from the zoning floor area. We can define a different amount depending on the type of floor they belong to: penthouse, ground floor or standard floor. This option can be useful to take into consideration some regulations that allow us to subtract from the zoning floor area a certain area for one reason or another.
Staircase Parameters
In this section the stairs of the project are defined from the following metrics: default minimum headroom in stair, default tread length, riser height, default stair slab width and number of steps in basement stairs.
It is essential to take into account that these data will be used to define the heights of the floors of the building, depending on the value assigned to the riser and the number of steps indicated in the "General floor plan - Design" section.
Advanced Controls
Here we find the controls that regulate the limit between the representation in one color or another. The value of the limit is the value of the difference between the requested metric and the actual metric obtained in the current layout. There are controls for both the area metric and the minimum dimension metric.
Presets
Presets are a system for saving and loading data sets. Their function is to save us time and work on repetitive actions.
They are implemented locally in each section of the Input panel and globally for all sections of the panel:
Preset Group
It is present in each section of the input panel and contains a drop-down list that allows us to select a preset. This will load the values stored in the preset into their respective configuration buttons.
The drop-down list also contains the Create and Delete Preset functions. As their names suggest, they allow us to create new presets, saving them with a given name, or delete one or more presets previously stored.
Preset Panel
Finally, the first section of the Input panel in each view, called the Preset panel, works in a similar way but on a larger scale. It allows us to store in a panel preset, the presets loaded into each section of the input panel.
It works in the same way as Preset Group, with the Select, Create and Delete Preset functions within the drop-down list.
Quick Start Guide: Previous | Next